The Sensor Network Museumtm - Sensor Network Experimental Data
Link Measurements with Tmote Skys
This site provides the data of link tests we performed with 18 Tmote Sky motes (2.4GHz) placed randomly (real-life like) in an indoor (office building) environment. Each link measurement is the record of the temporal characteristics of a link during typically 30 minutes based on a packet stream with a frequency of 5 packets every second (10'000 packets in all). We ran the measurements with different sender nodes and with a total of 2 millions sent packets and about 600 links.
The most important information about our measurements can be found on this web page. For more details we recommend to have a look at the INSS'08 paper or the Master thesis of Tobias Rein. The full dataset is available as MySQL database and the download can be found at the bottom of this page.
- A. Meier, T. Rein, J. Beutel and L. Thiele: Coping with Unreliable Channels: Efficient Link Estimation for Low-Power Wireless Sensor Networks. Proc. 5th Intl Conf. Networked Sensing Systems (INSS 2008), pages 19-26, Kanazawa, Japan, June 2008. [pdf] [bibtex]
- Rein, Tobias: Energy and Time Efficient Link-Quality Estimation for Wireless Sensor Networks. Master Thesis, ETH Zurich, April 2007. [pdf]

Floorplan ETZ G-Floor
Test procedure
The link quality measurements are arranged in tests. Each of these tests proceeds as follows: A sender broadcasts a number of packets with a given frequency; one or more receiver listen continuously and log the data of the received packets. This is namely the sequence number and the two link quality indicators RSSI and LQI.
Location
The measurements took place on the G-Floor of the ETZ building (ETH Zurich). The nodes have been randomly distributed over multiple rooms as shown in the picture on the right.
Test Series
For our measurements, we defined different test series. A test series consists of several tests with the same parameters and the same participating nodes. In each test of the series, one node is the sender and the others are the receivers. Typically, all involved nodes are dedicated to be the sender once in each series in a round robin like manner. The table below gives you an overview of the different series we run.
| Test ids | Description |
| 100 ... 239 | Test measurements |
| 241 ... 245 | Long tests (10'000 packets) |
| 246 ... 255 | Night tests I |
| 258 ... 275 | Echo tests with selected nodes |
| 276 ... 285 | Night tests II (one week later) |
| 286 ... 295 | Day tests |
| 300 ... 329 | Echo test with selected nodes (nodes 7, 10 & 20) |
| 330 ... 339 | Night tests (low power) |
| 340 ... 352 | Night tests with three additional nodes (full power) |
| 360 ... 369 | Night tests III (one month later) |
| 500 ... 512 | Tests with an extended setting |
| 550 ... 579 | Echo tests with the extended setting (nodes 31 & 43) |
Link Analysis
With the measured data we did different kind of evaluations. In the following, a selection of these analyzes is shown. For some examples you can find a comma-separated file which contains exactly the data, which is needed for that specific example. If you'd like to reproduce the figures or do your own analysis, you should download the whole database and the corresponding Matlab scripts.
Temporal Behavior
These examples show the temporal behavior of the links during our tests. The packet reception rate (PRR) is the percentage of packets that have been received out of all sent packets. For more information see chapter Temporal Link Behavior of the Master Thesis of Tobias Rein.
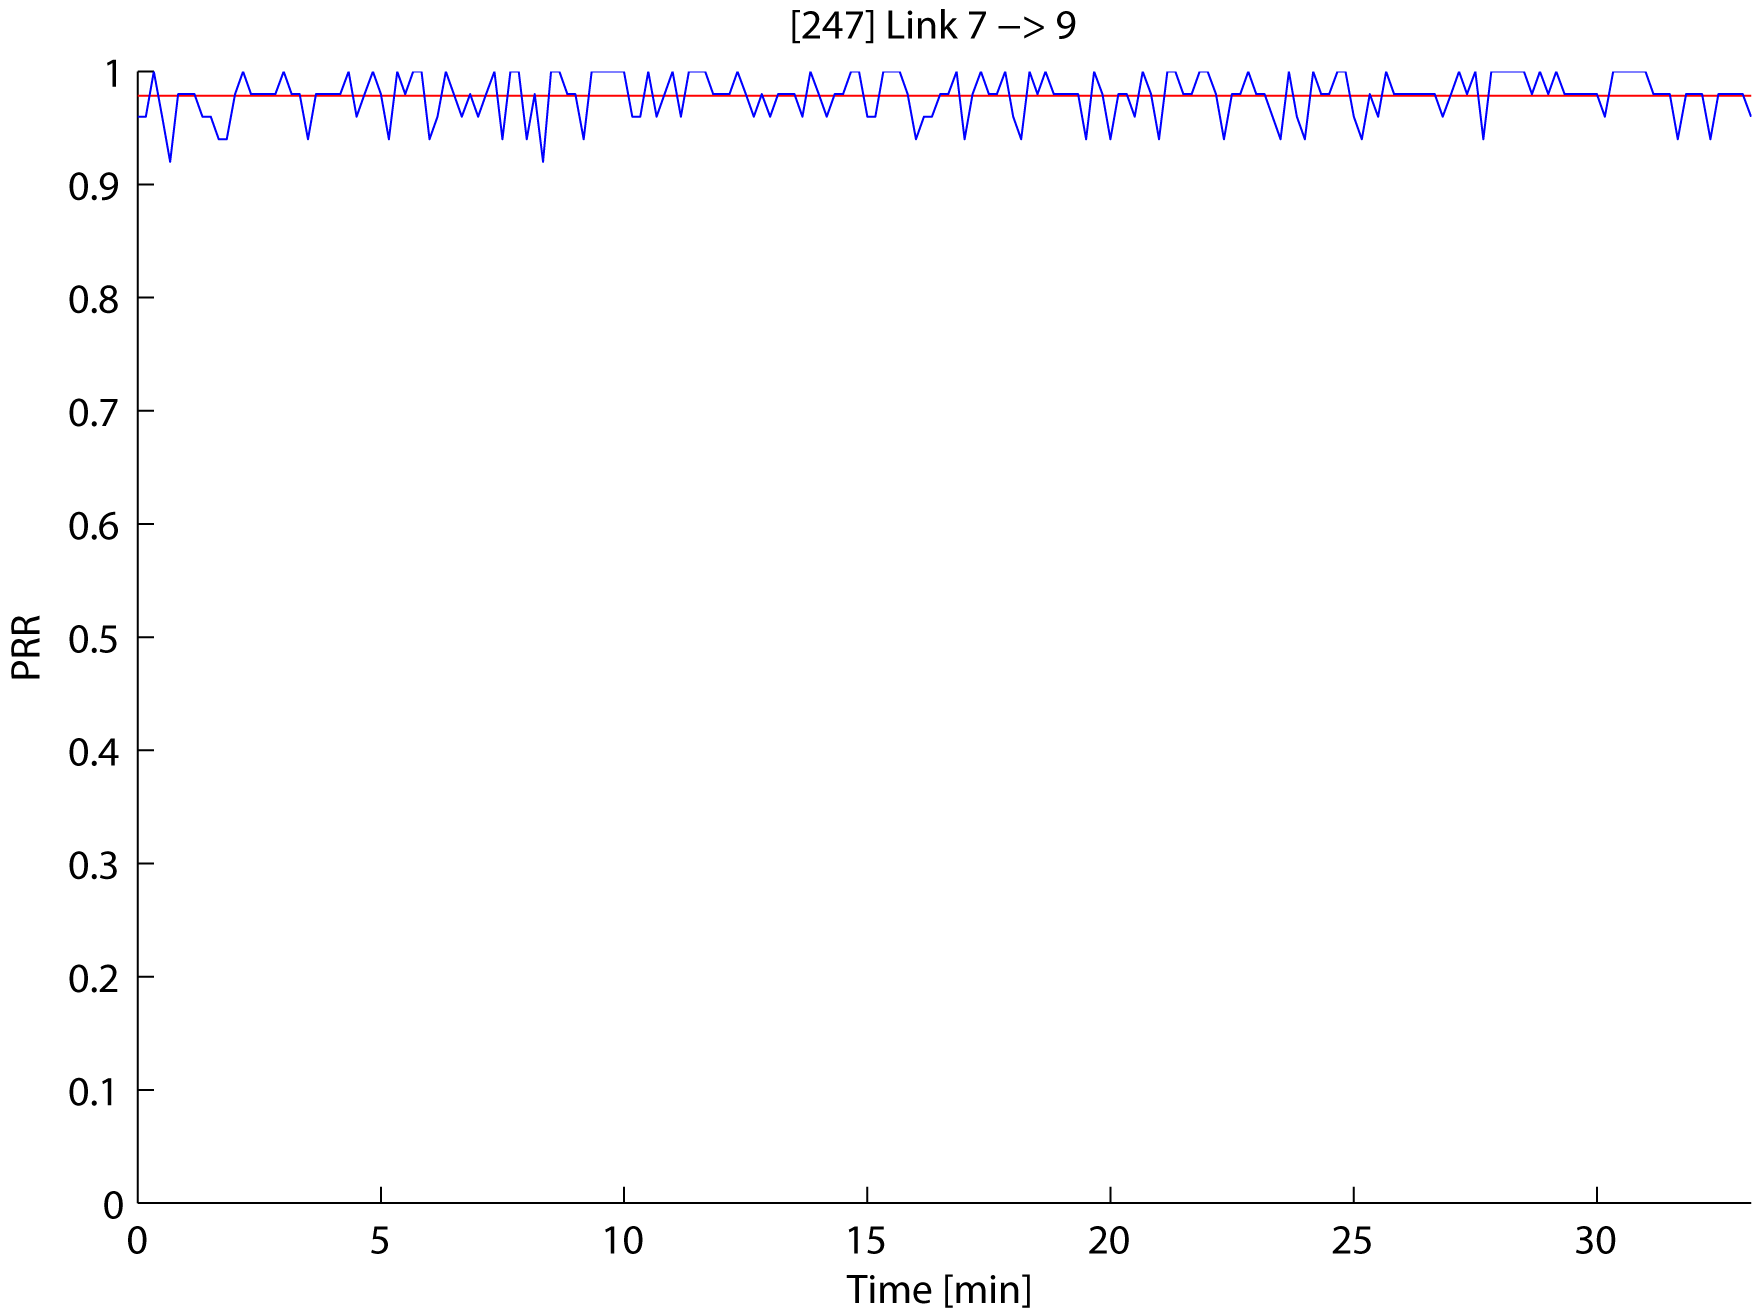 Test id: 247, TX id: 7, RX id: 9 Download the data: csv-file |  Test id: 280, TX id: 2, RX id: 10 Download the data: csv-file | 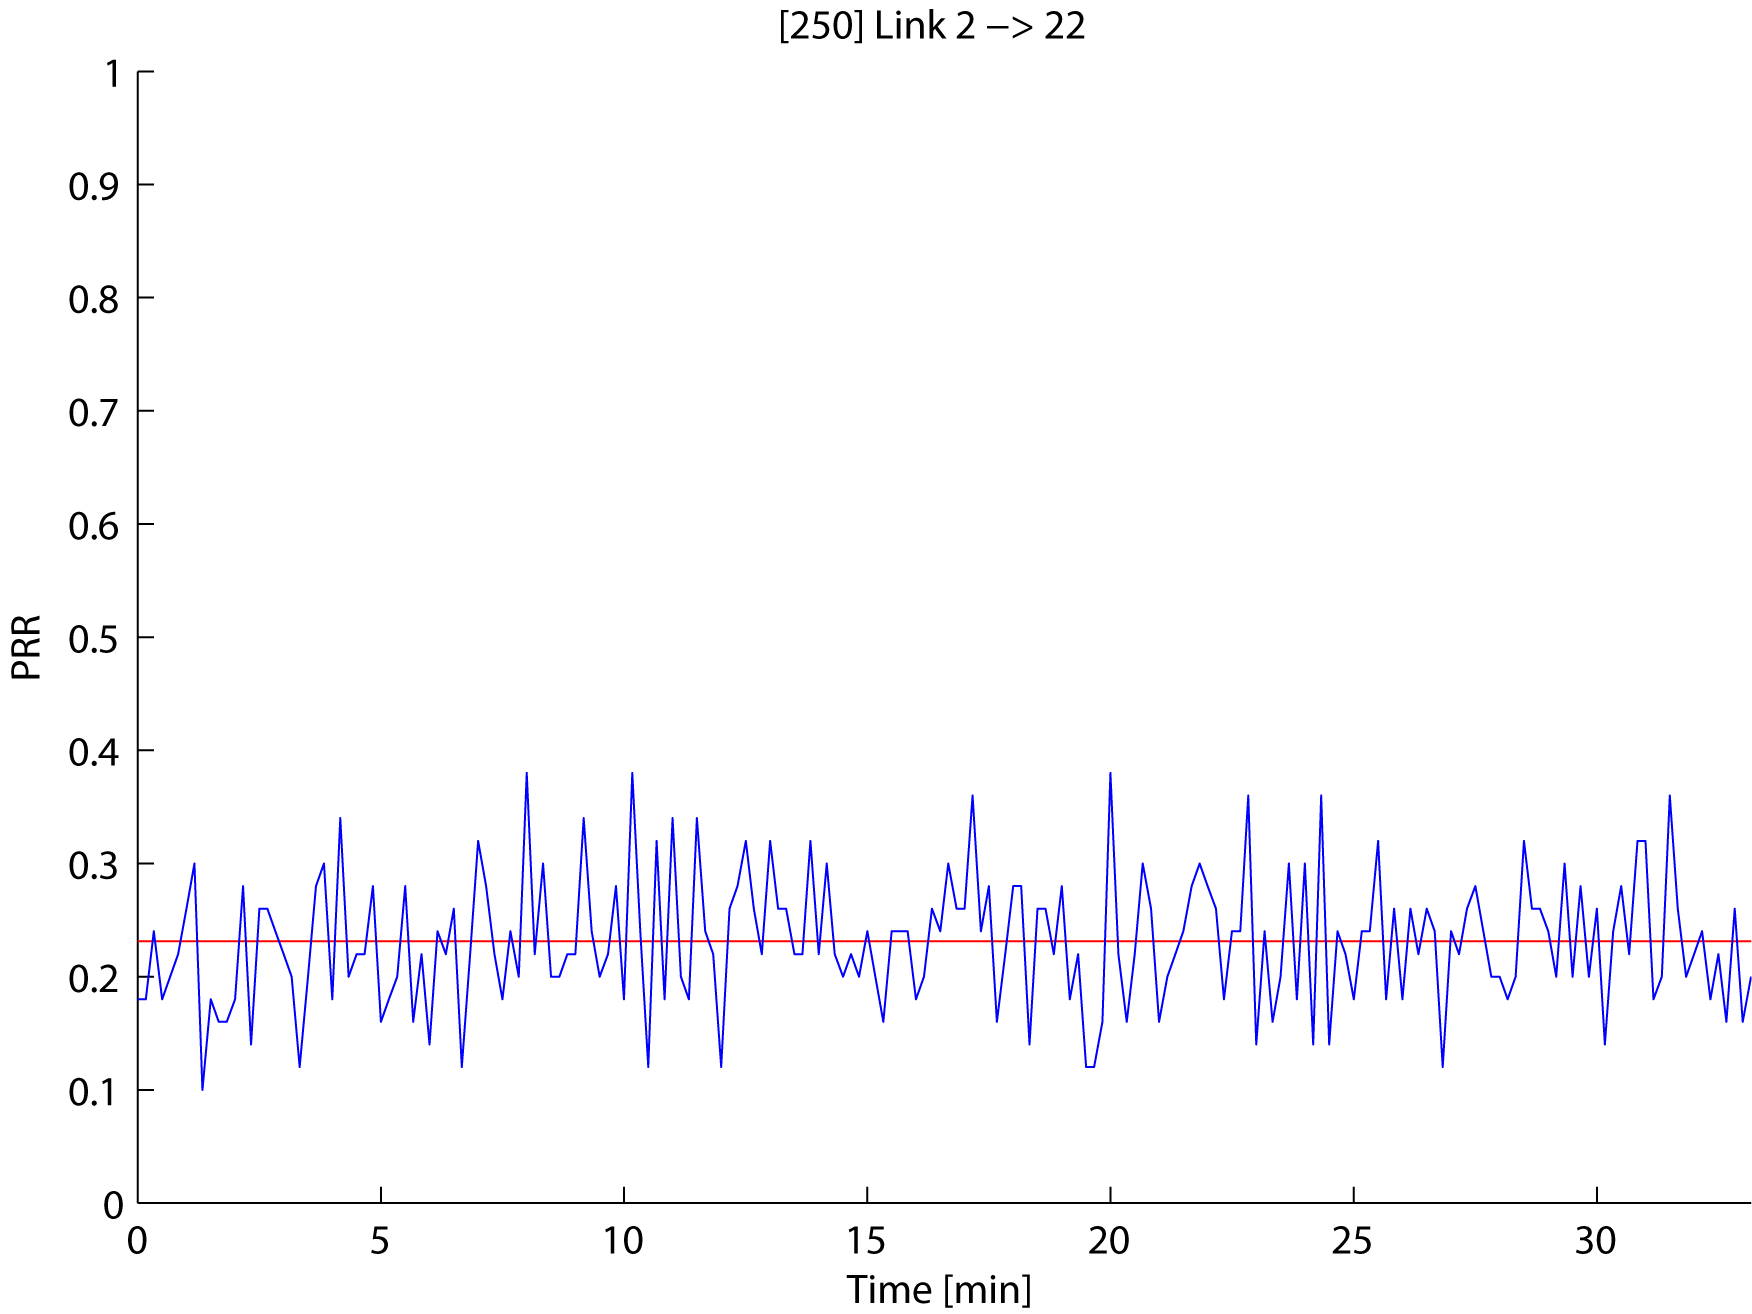 Test id: 250, TX id: 2, RX id: 22 Download the data: csv-file |
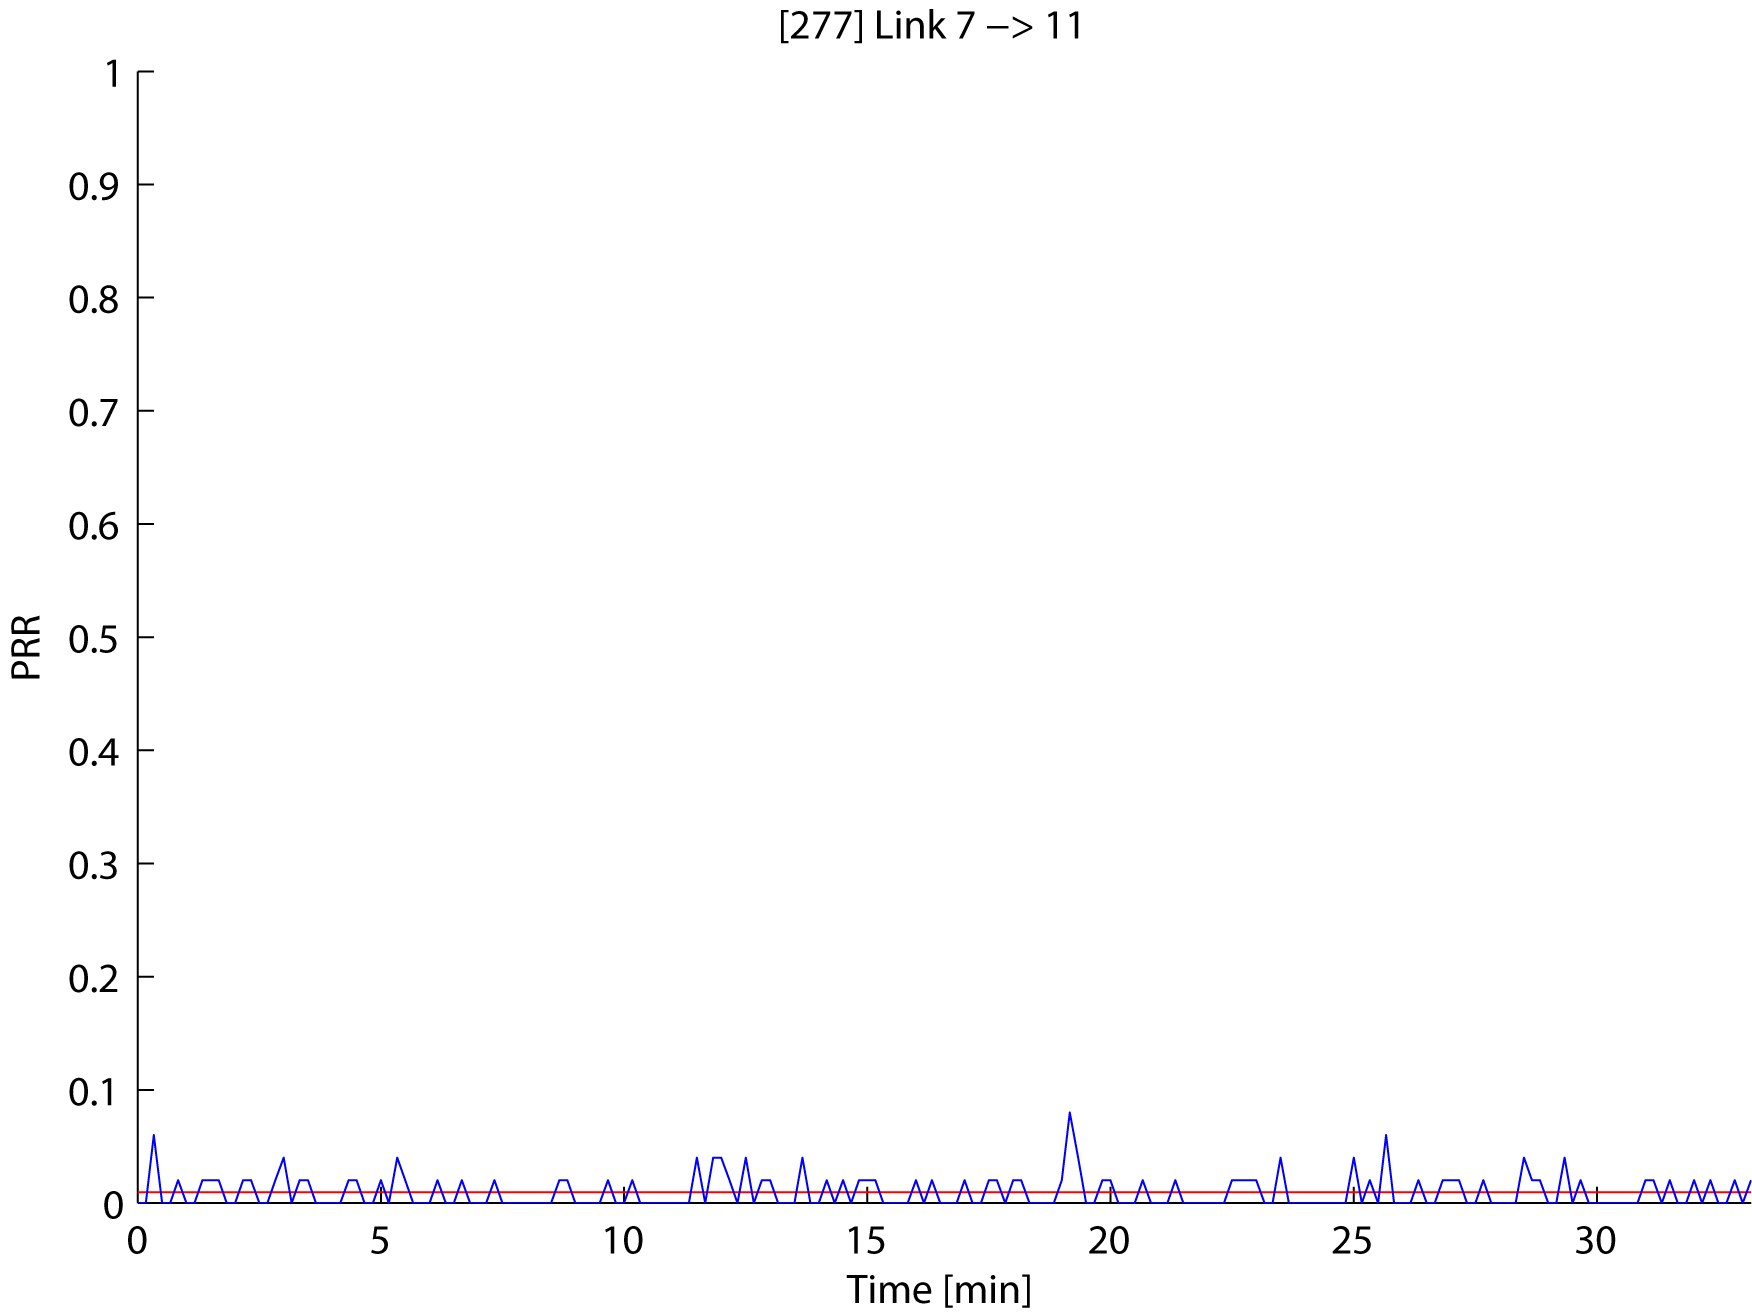 Test id: 277, TX id: 7, RX id: 11 Download the data: csv-file |  Test id: 286, TX id: 22, RX id: 20 Download the data: csv-file |  Test id: 255, TX id: 5, RX id: 13 Download the data: csv-file |
RSSI and LQI values
In the following, the relations between the PRR and the link-quality parameters are given. The left picture shows the relation between the average RSSI value we measured for one link during one test and the PRR of this link. The picture on the right shows this relation for the LQI value.
(For this evaluation the information out of all tests is needed. Therefore, we can not provide a csv-file and request you to download the whole dataset if you like to do this kind of analysis.)
 |  |
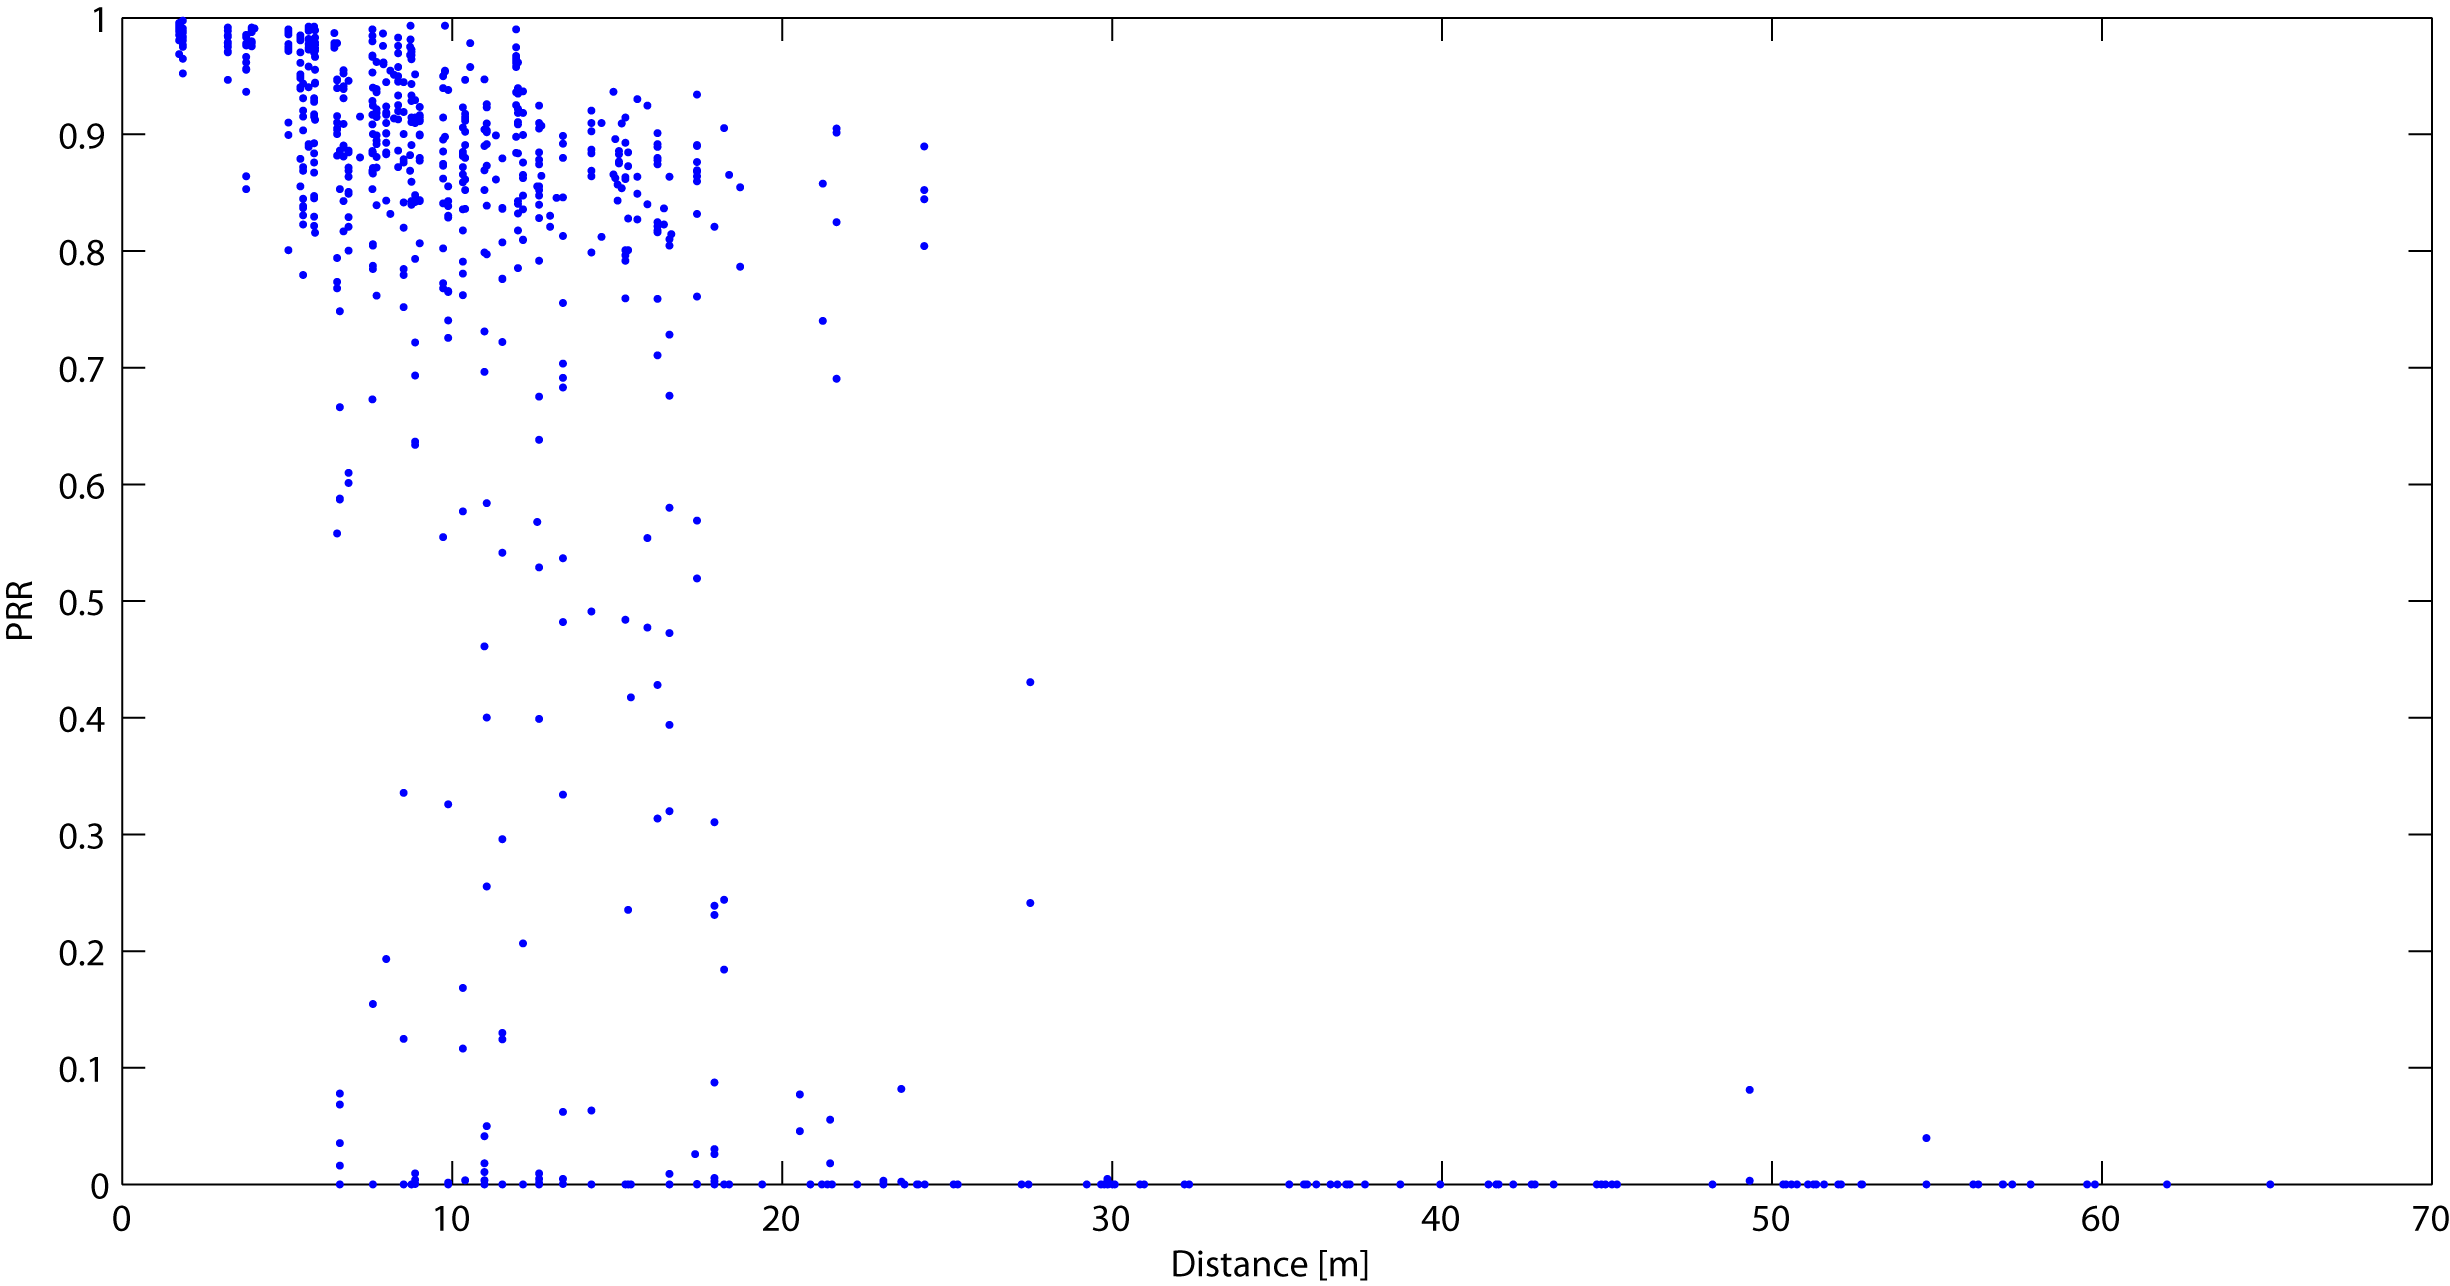
Spatial Characteristics
Furthermore, we evaluated the spatial characteristics of the packet reception rate (PRR). That means we analyzed how the distance between the sender and the receiver correlates with the PRR.
(Again, you need to download the whole dataset if you like to do this analysis.)
Link Asymmetry
We run test series in which only two nodes participated and in which the receiving node sends an acknowledge for every received packet. The sender logs the information of the received acknowledge packets as well. We called this kind of series echo tests. With these tests we can evaluate the asymmetry of the links. To understand the figures underneath it is necessary to read the section Link Asymmetry of the Master Thesis of Tobias Rein.
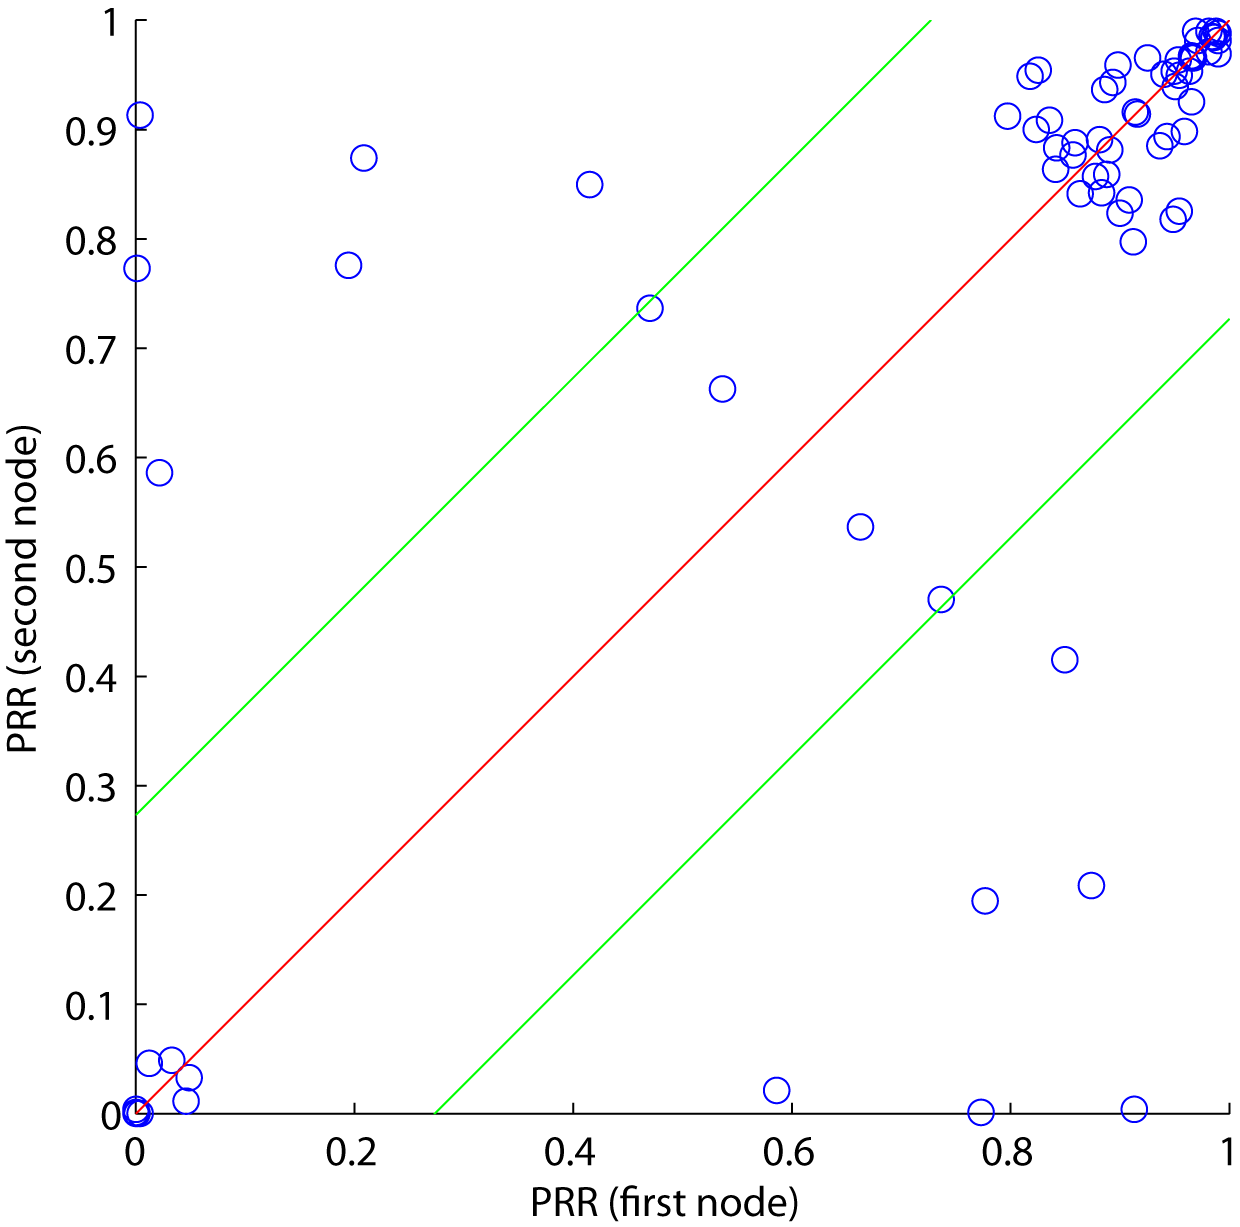 |  |
Download
In this area you can download the dataset of our measurements. There are two possibilities: a MySQL dump or multiple csv-files.
MySQL Dump
| Dataset as MySQL Dump (zip-file, 49.9 MB) |
Hint: Since the extracted sql-file has a size of almost 400 MB you can not use the phpMyAdmin tool to import the data in your own database. Therefore, we recommend using the shell command (the execution may take several minutes):
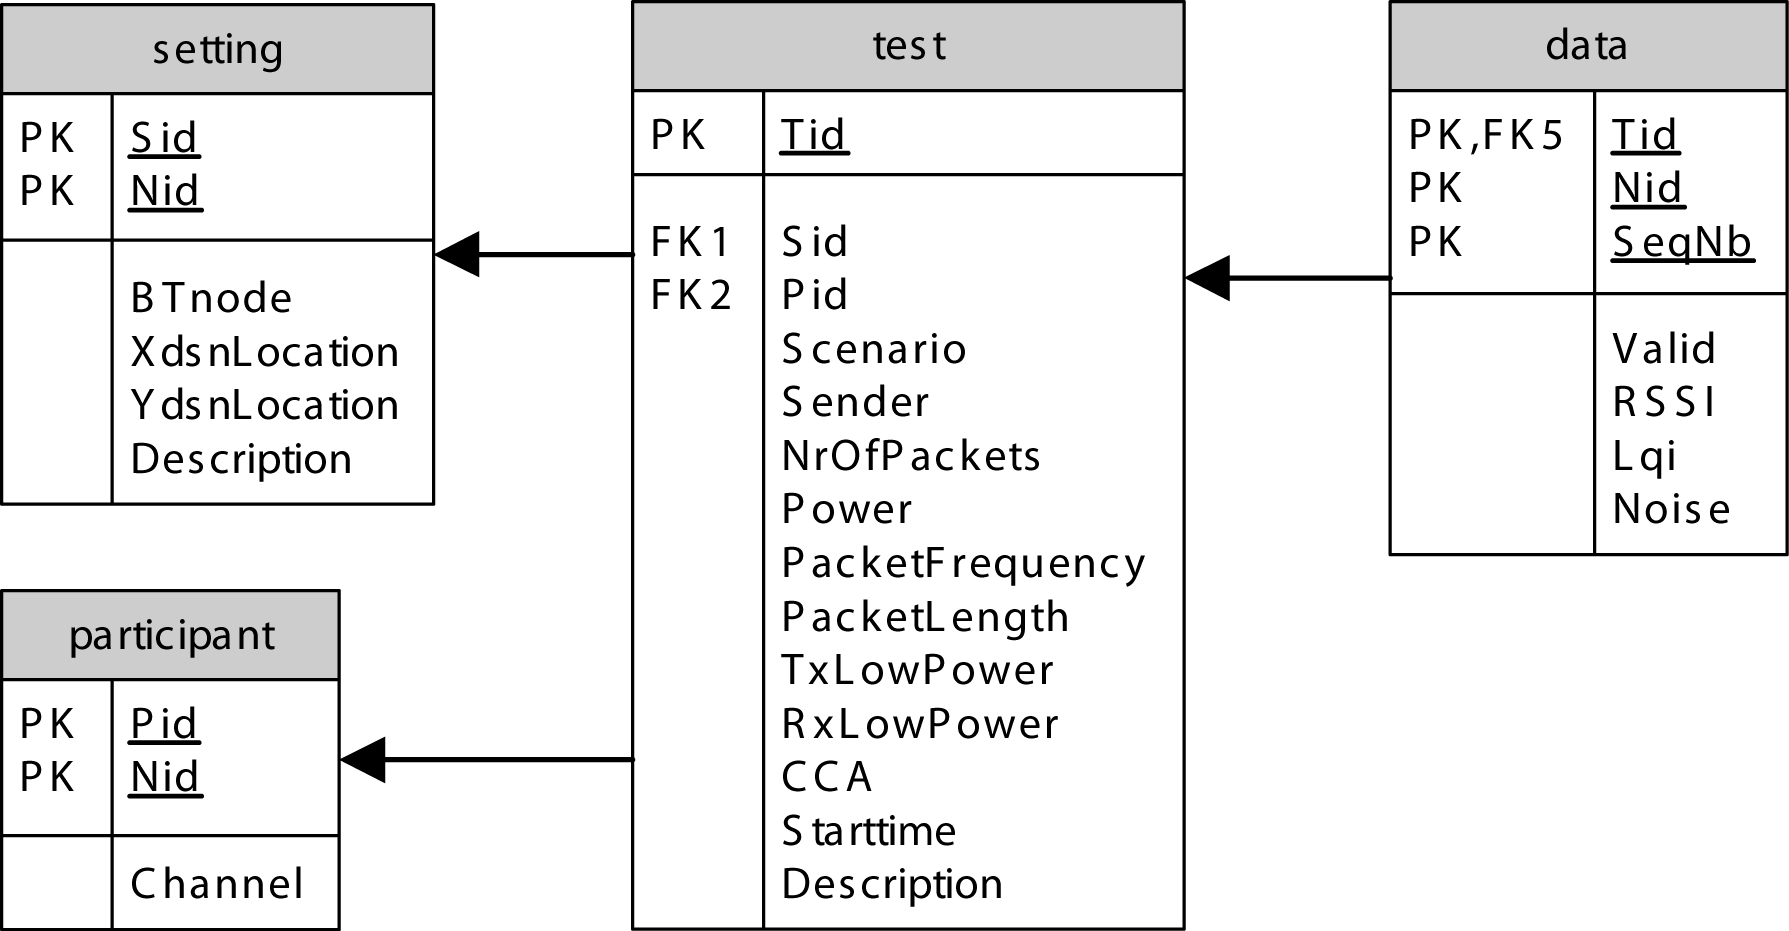
The database contains four tables:
- test: Holds the parameters for the tests
- setting: Gives the linking of the Tmote Sky to the BTnodes of the DSN
- participant: Indicates which Tmote Skys participate in a test
- data: Contains the measured data of the tests
CSV-Files
There is also the possibility to download only the data table in the form of csv-files. Each of these files contains the data for one single test.
| Dataset as csv-files (zip-file, 48.4 MB) |
Matlab scripts
In addition to the dataset, we provide the Matlab scripts that generate the figures above.
| Matlab scripts (zip-file, 7 KB) |
The scripts read the data from a MySQL database. Therefore, it is essential to set up your own database and to import the given dataset. In addition, you need to carry out the following three tasks:
- Add the directory LM to your Matlab paths. This directory contains auxiliary functions for the link measurement analysis.
- Download the mysql function from the University of Toronto homepage. This function is needed to gather the data from the database.
- Set the host, user, password and database in the LM/LMopenDB.m file.